Korean Government Website Contractors
2016
Who makes these websites? Rummaging through the mess of Korean online data systems for public contracts and visualizing some findings. Based on final project for Data Visualization Methods, Spring 2016.
Introduction
South Korean public websites are notorious to its users for being inconvenient. Outdated ActiveX plugins, absent SSL certificates, mistranslation and clunky interfaces prevail. One might argue that most government websites are hard to use; however, there is something about the South Korean ones which differentiates it from the English-speaking majority of the internet. A persisting characteristic is the pervasive use of external plug-ins such as ActiveX and semi-private security certificate programs in public websites and online transactions. Whether one wanted to surf through a government-made online archive, check a bank statement or fill out a tax form, especially when filling out a tax form, it has been customary over many years that one is asked to install a handful, or even dozens of plug-ins in order to be able just to sign in to a website. And even when you succeeded at logging in, often the website would break at an unexpected point. This tumblr is a collection of such moments.
There are many contributing factors to how government websites came to be shaped as such. Microsoft, which created ActiveX, held monopoly over the OS market until the 2000s; government-imposed regulations mandated use of the outdated technology; interest groups built a monopoly out of the technology, etc. However, this is not the place to develop a history of internet development in South Korea; that will be a bigger project, which this assignment will be part of. Instead, here I want to focus on a simple question: who is building those government websites? While there is criticism on how bad these websites are designed and how many security breaches have occurred, the question of where the websites come from and who created them is less addressed. Yet, it is important to understand the social and material process which creates government websites, and the web—and one way to do so is by examining the actual creators.
The Data
In order to answer this question I used data from the Korea ON-Line E-Procurement System. (KONEPS, www.g2b.go.kr) KONEPS is a centralized online bidding platform that facilitates contracts between the government and private companies. All government procurement notices are required to posted publicly in this system, except for a small number of exempted organizations. By using a script that searched for the terms ‘홈페이지,’ ‘블로그,’ ‘웹,’ ‘포탈’ and ‘포털,’ (lit. homepage, blog, web, and portal), I was able to get a dataset of 5,939 auctions from 2006 to 2015, categorized as ‘service’ procurements and where a winner was defined. In addition, I scraped the information of 1,690 unique businesses that participated and used the map APIs from Daum and Google in order to convert addresses to geo-coordinates. Since there exist other categories of procurement auctions such as ‘commodities,’ this is not a complete dataset. However, ‘service’ accounts for more than half of the total data and I expect it to be helpful in showing some tendencies, especially in this early part of a bigger inquiry.
First, some basic exploration of the data. The data from KONEPS contains a range of information: auction id number, auction title, auction category, procuring agency, winning business’ registration number, date, number of reauctions, number of bidders, winner, bidding amount, bidding rate, english name of winning company, its CEO, company address, phone, and url.
Here I plotted all ~6K auctions by bidding amount: the red histogram shows the distribution of auctions over winning bid, and the blue line shows the mean average number of bidders. We can see that most auctions fall between 10M KRW and 100M KRW, and that those tend to be more competitive than auctions won by bids higher than 100M KRW. (~= 85K USD)
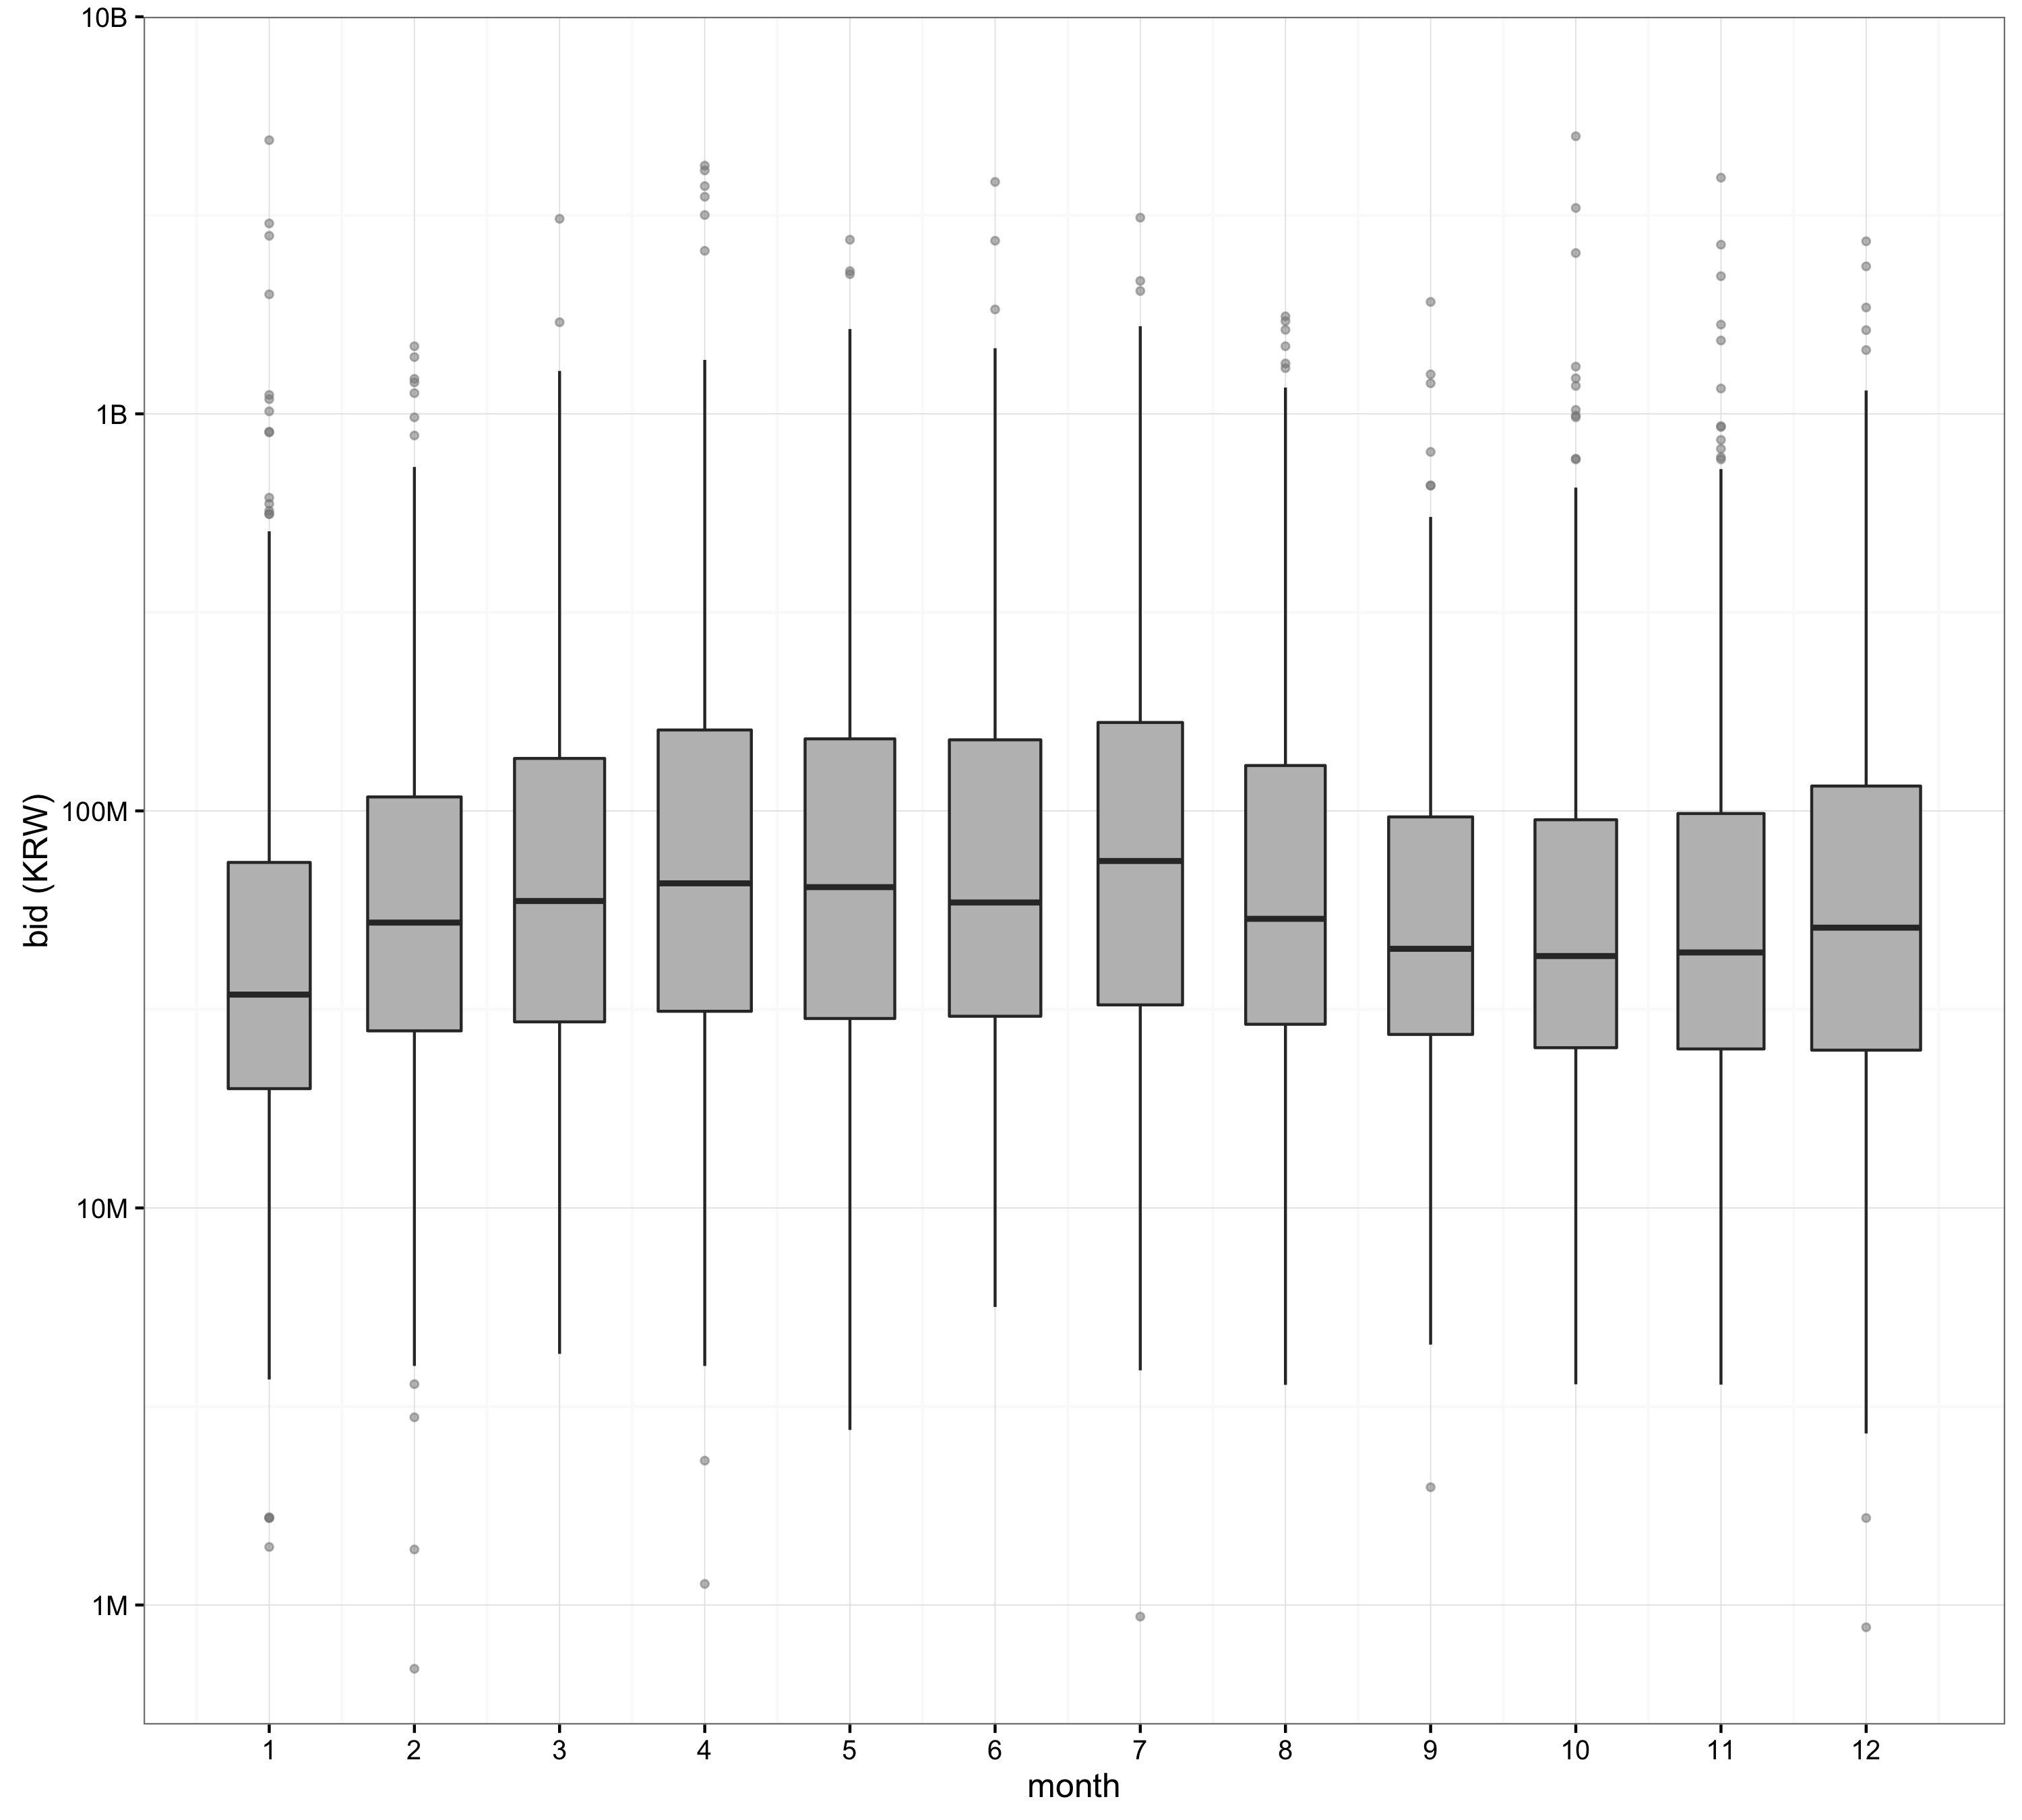
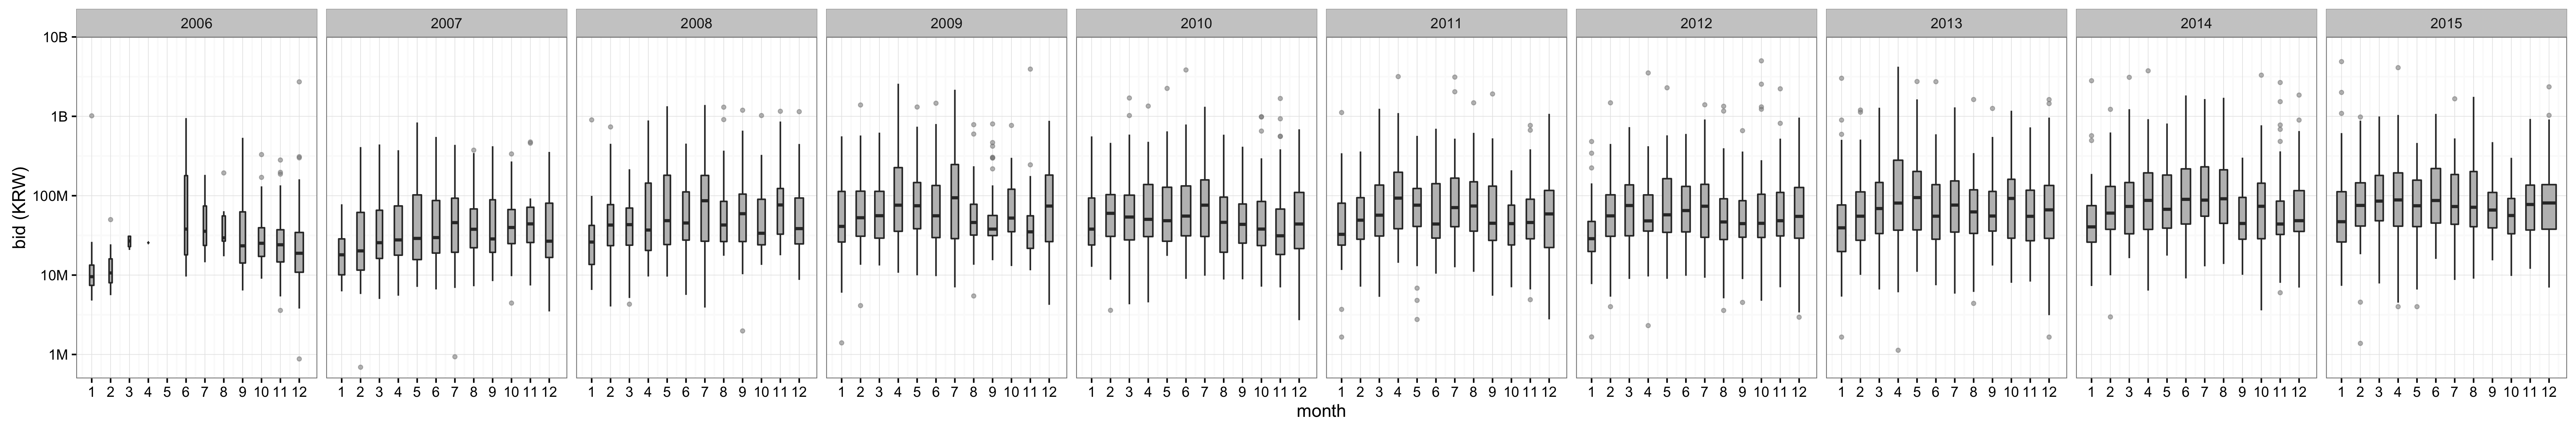
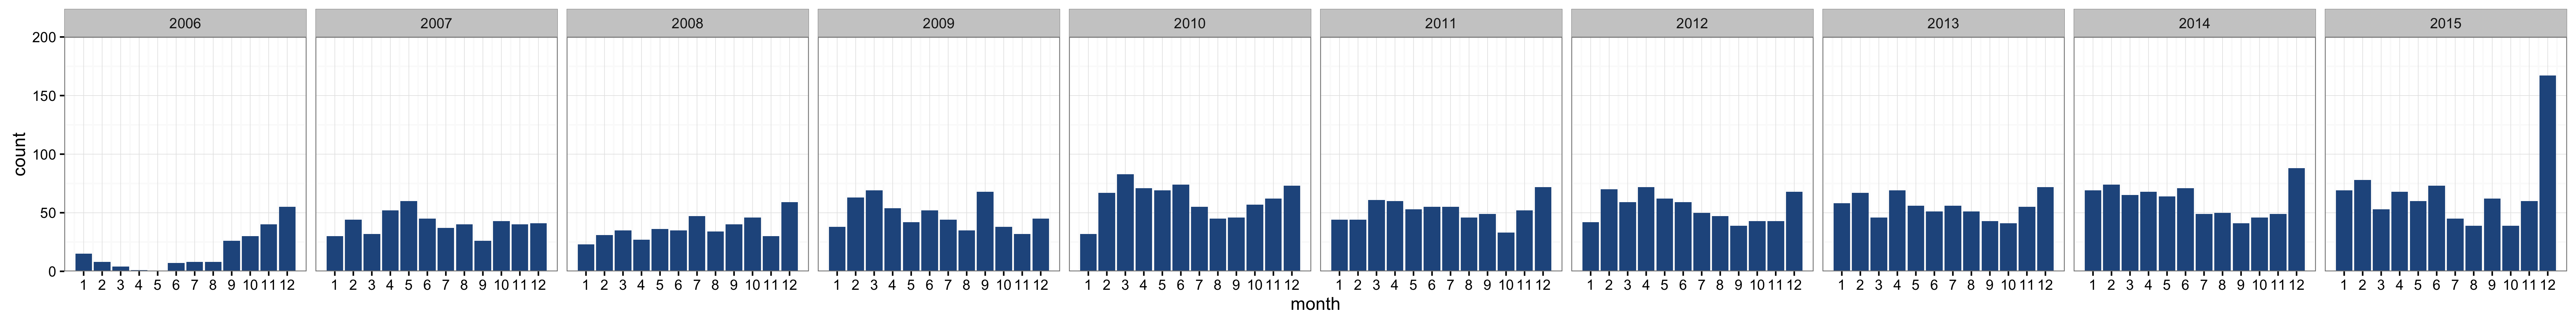
One interesting pattern is that higher winning bids tend to occur in summer:
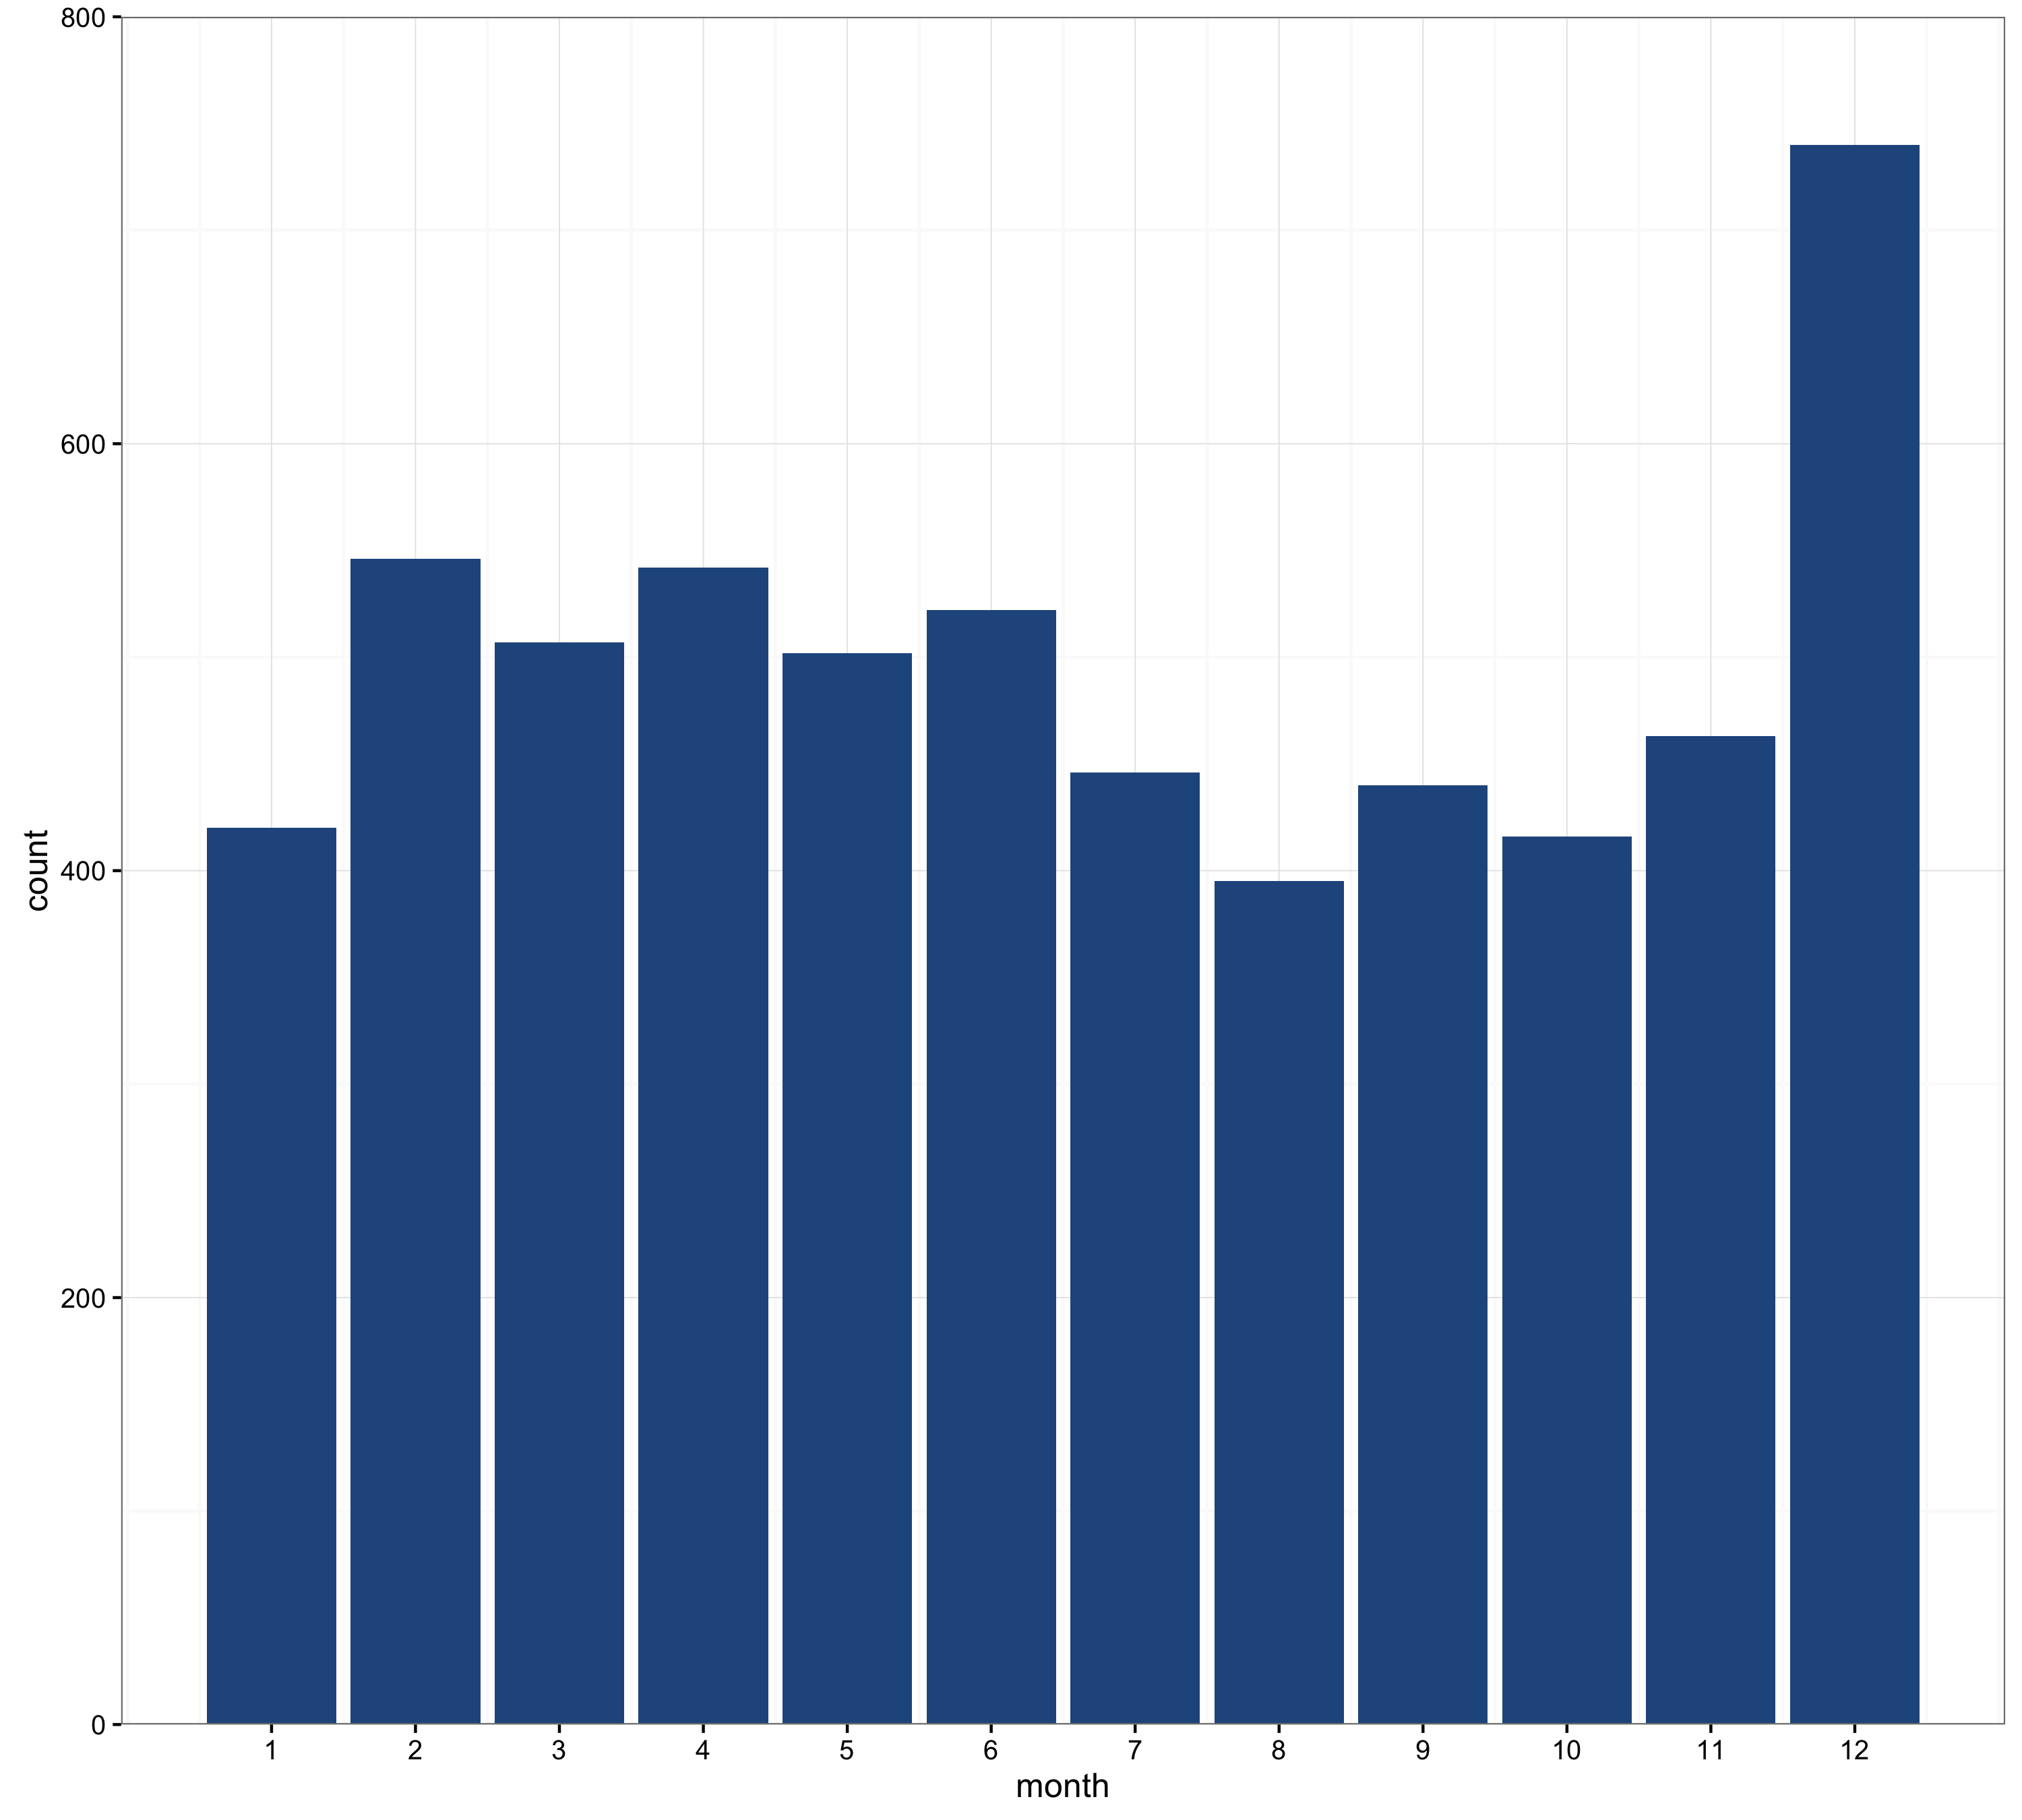
Throughout the average year, the number of successful auctions tend to be stable in the first half and increase in December, which is the end of the fiscal year.
The Builders
This is a list of all businesses that won an auction in the dataset, plus company information and amount of money won:
One thing to note is that approximately 22% of these companies do not have a website url listed in the KONEPS database, when these auctions all are web-related—most of them web development projects. It is also interesting to look at the websites of the higher-grossing companies; many of them are quite outdated. A company’s own website seems not to be a big factor in obtaining a bid. One company that caught my attention is ASADAL INC. (http://www.asadal.com/) This company specializes in government system integration tasks, and their website’s overcrowded design symbolizes many things that I find distinctive of the South Korean web.
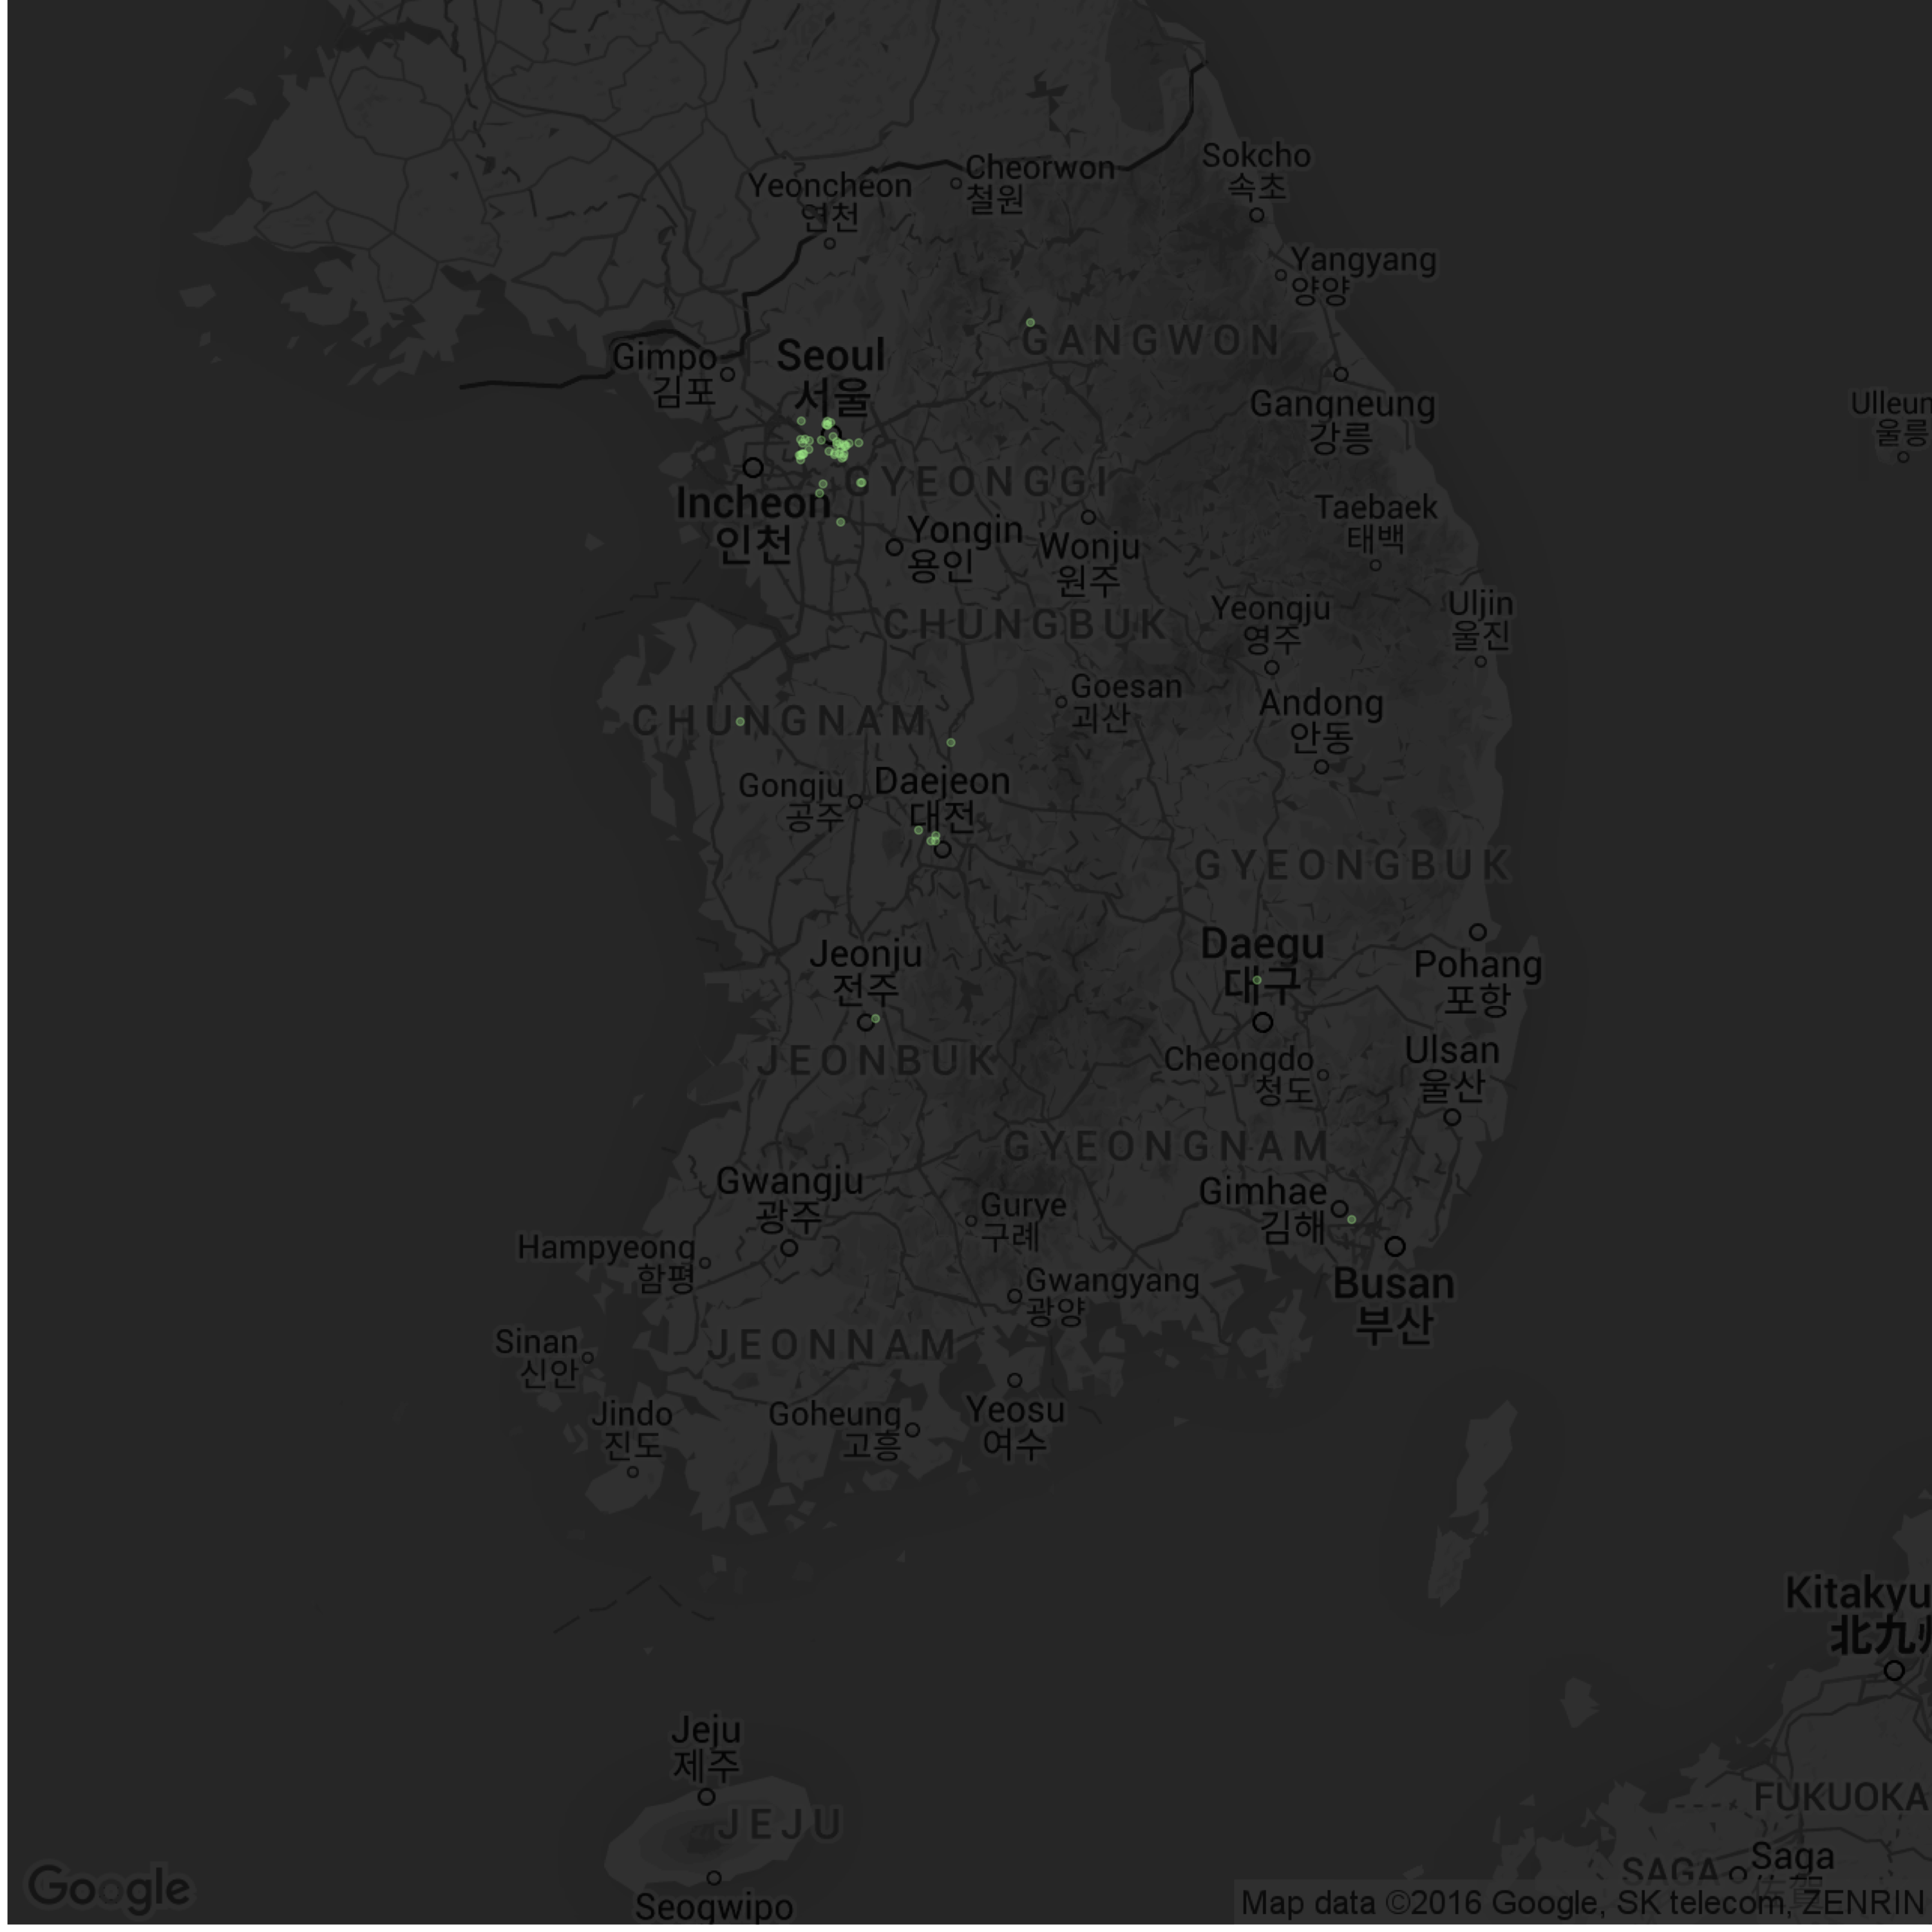
More than half of the companies are located in the capital, Seoul; Seoul and the surrounding Gyeonggi region combined add up to 1,038 companies, which is also made evident in the following map of all companies.
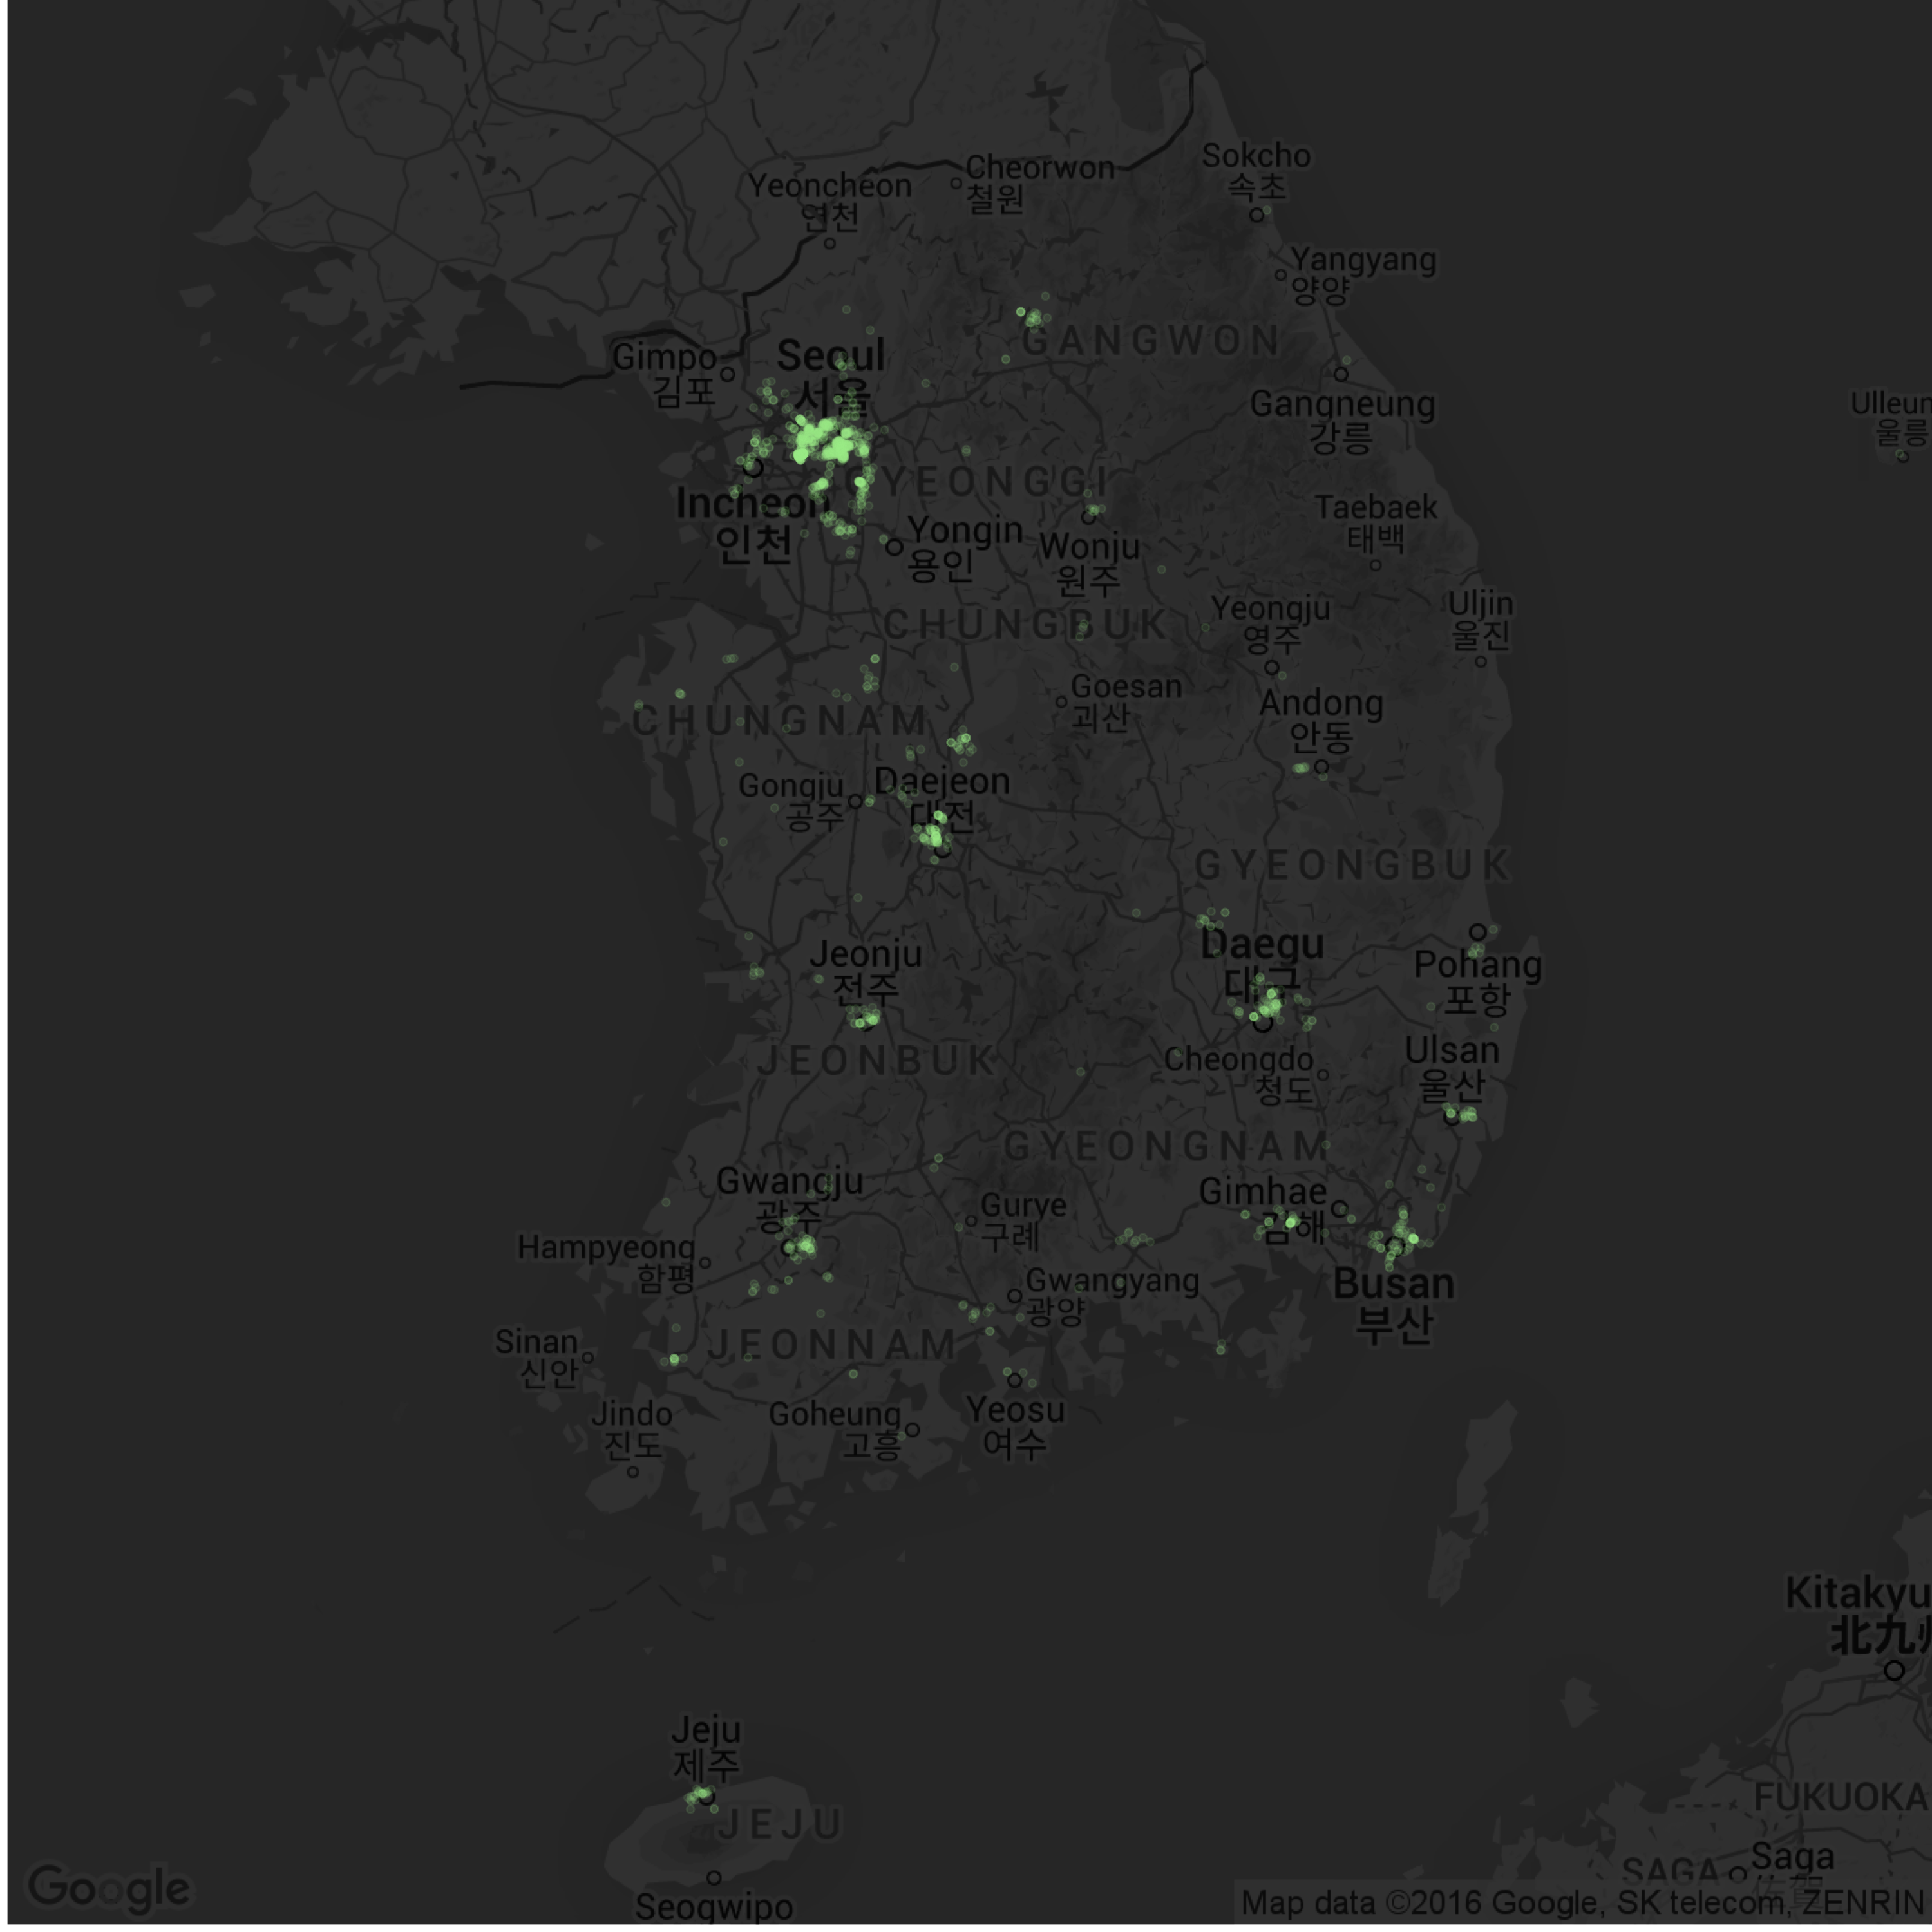
Since Seoul and Gyeonggi amount to about half of the South Korean population, the number of businesses is not especially surprising. However, not only are there more businesses in the capital area, but they also tend to do better. This map of the top 50 grossing companies show much more companies around Seoul than what a simple proportional distribution would show:
We can also verify the regional disparity in more detail, first with this plot of means and medians of each region:
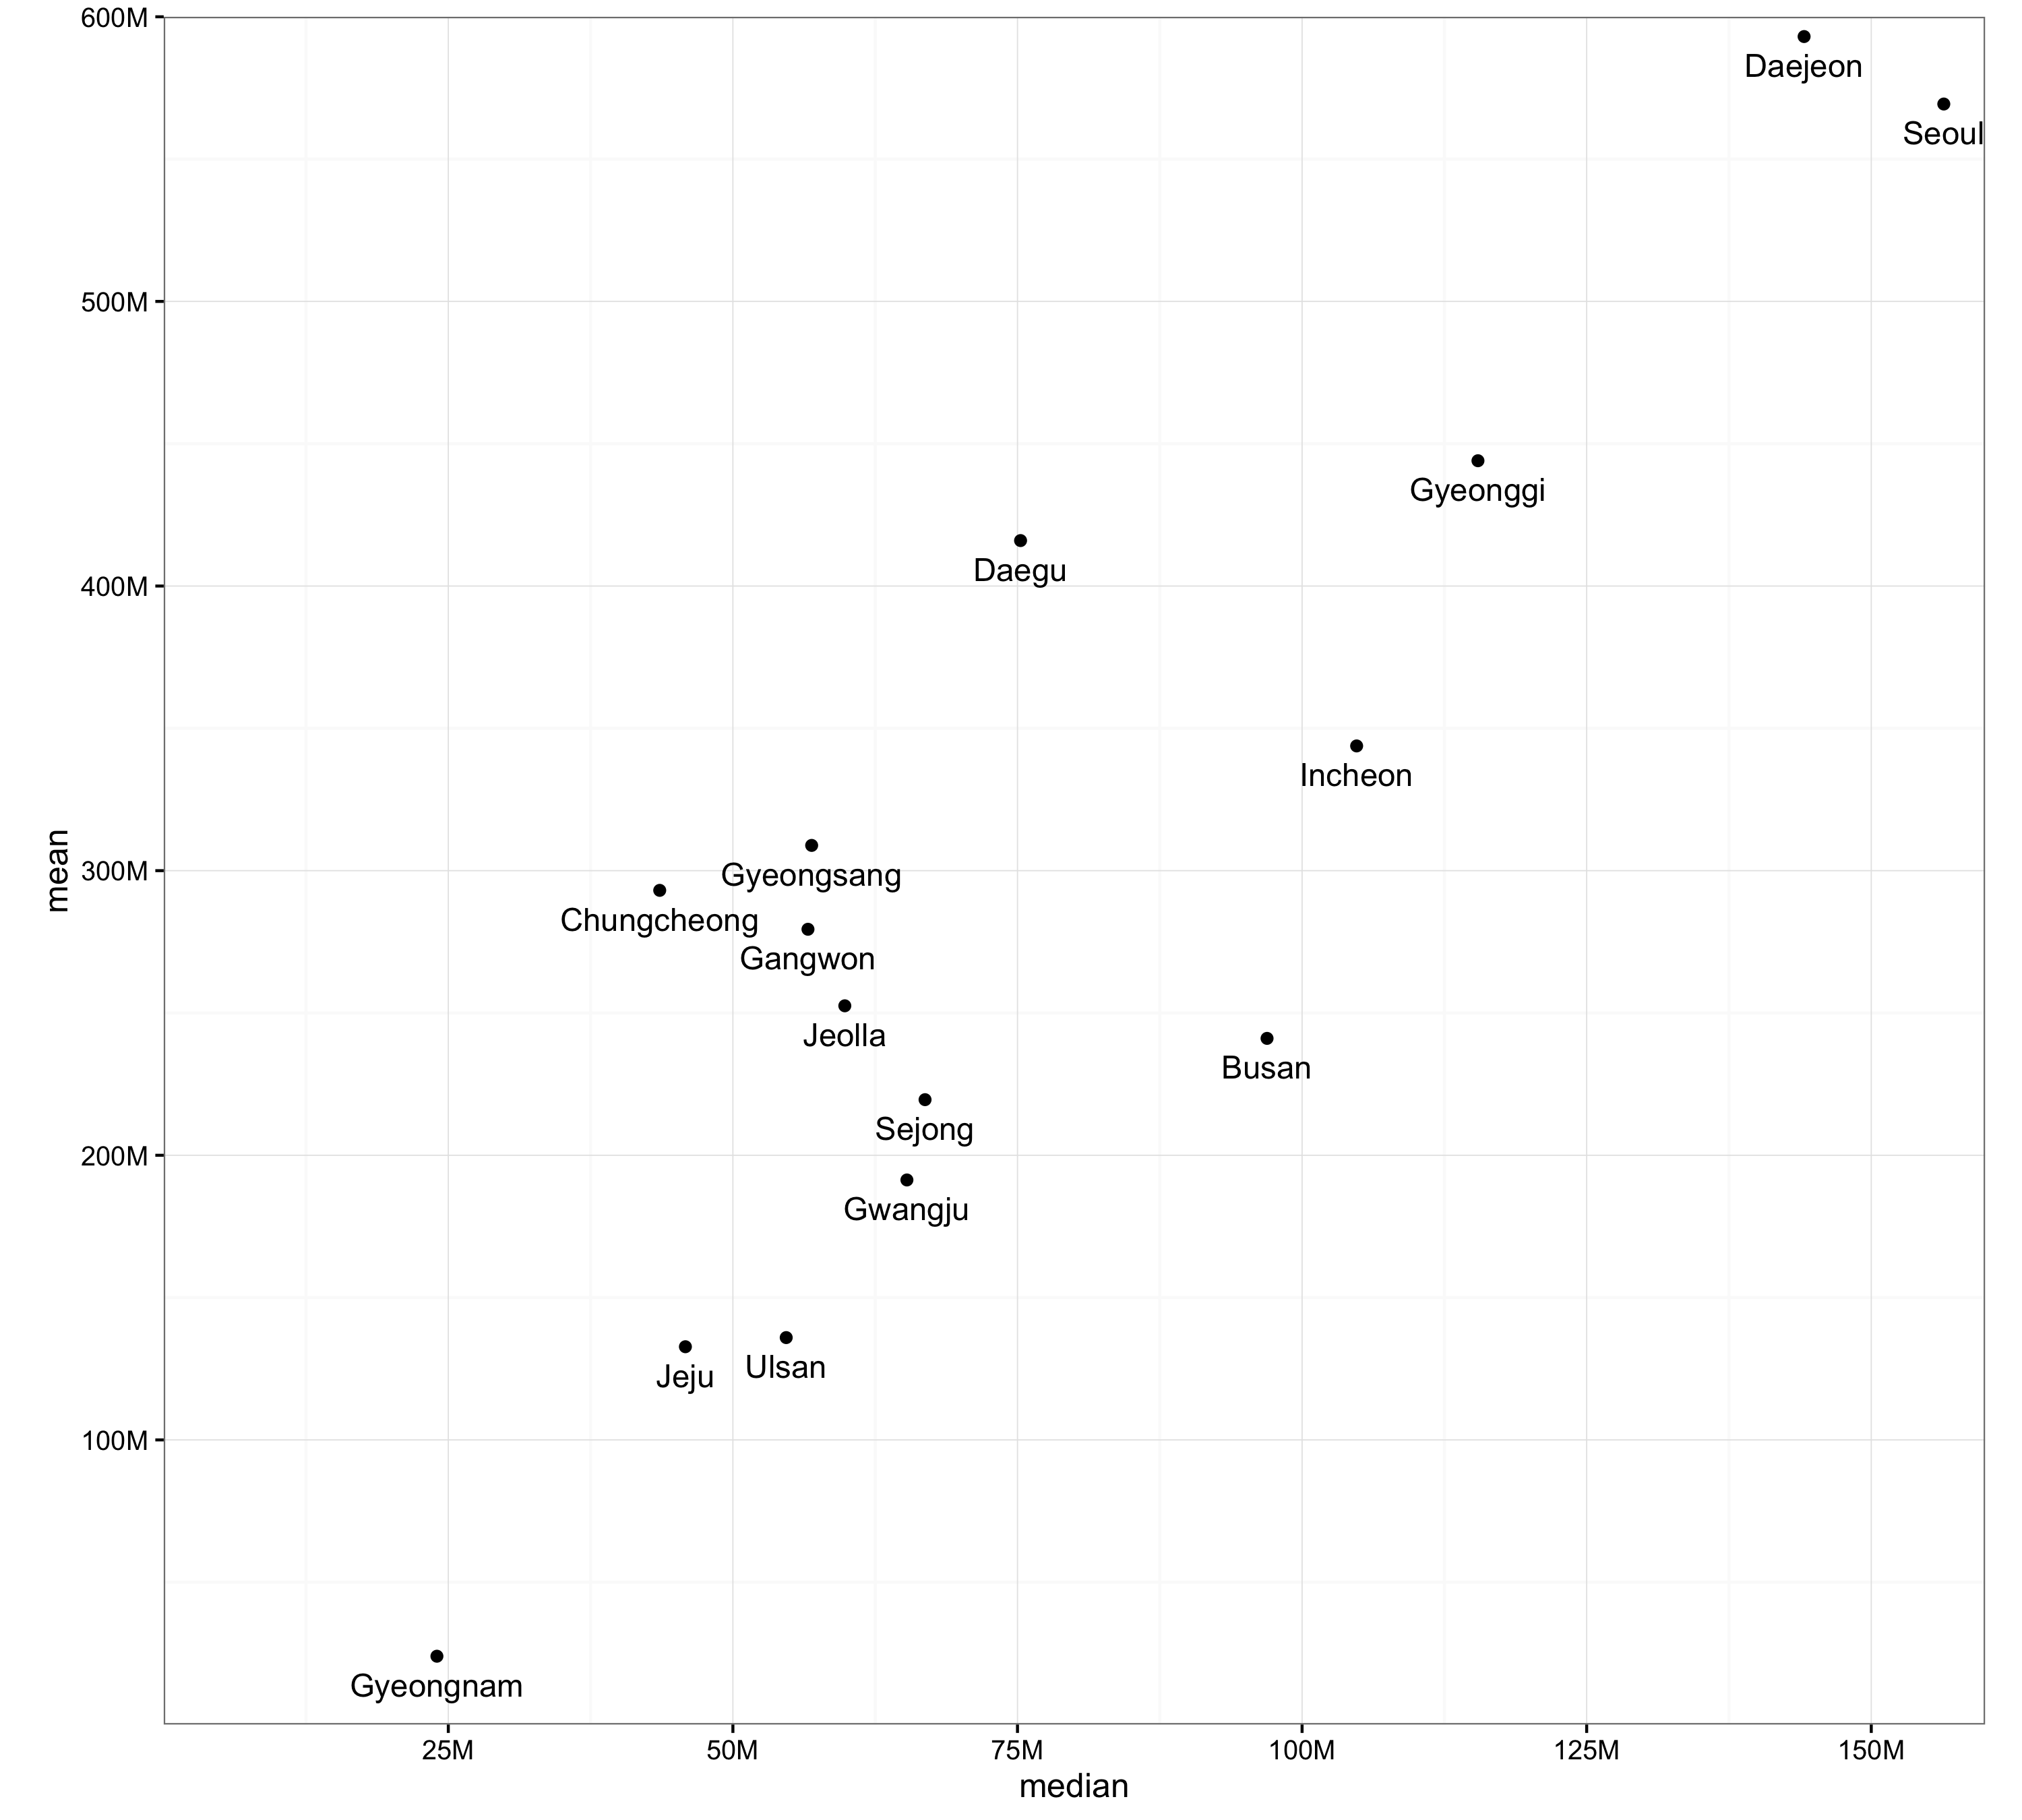
The positions of regions in the above graph do not really correspond to the economic aspects of regions, such as GDP: https://en.wikipedia.org/wiki/List_of_South_Korean_regions_by_GDP. Instead, the more probable explanation would be that the graph reflects the administrative importance of regions, considering the origin of the dataset.
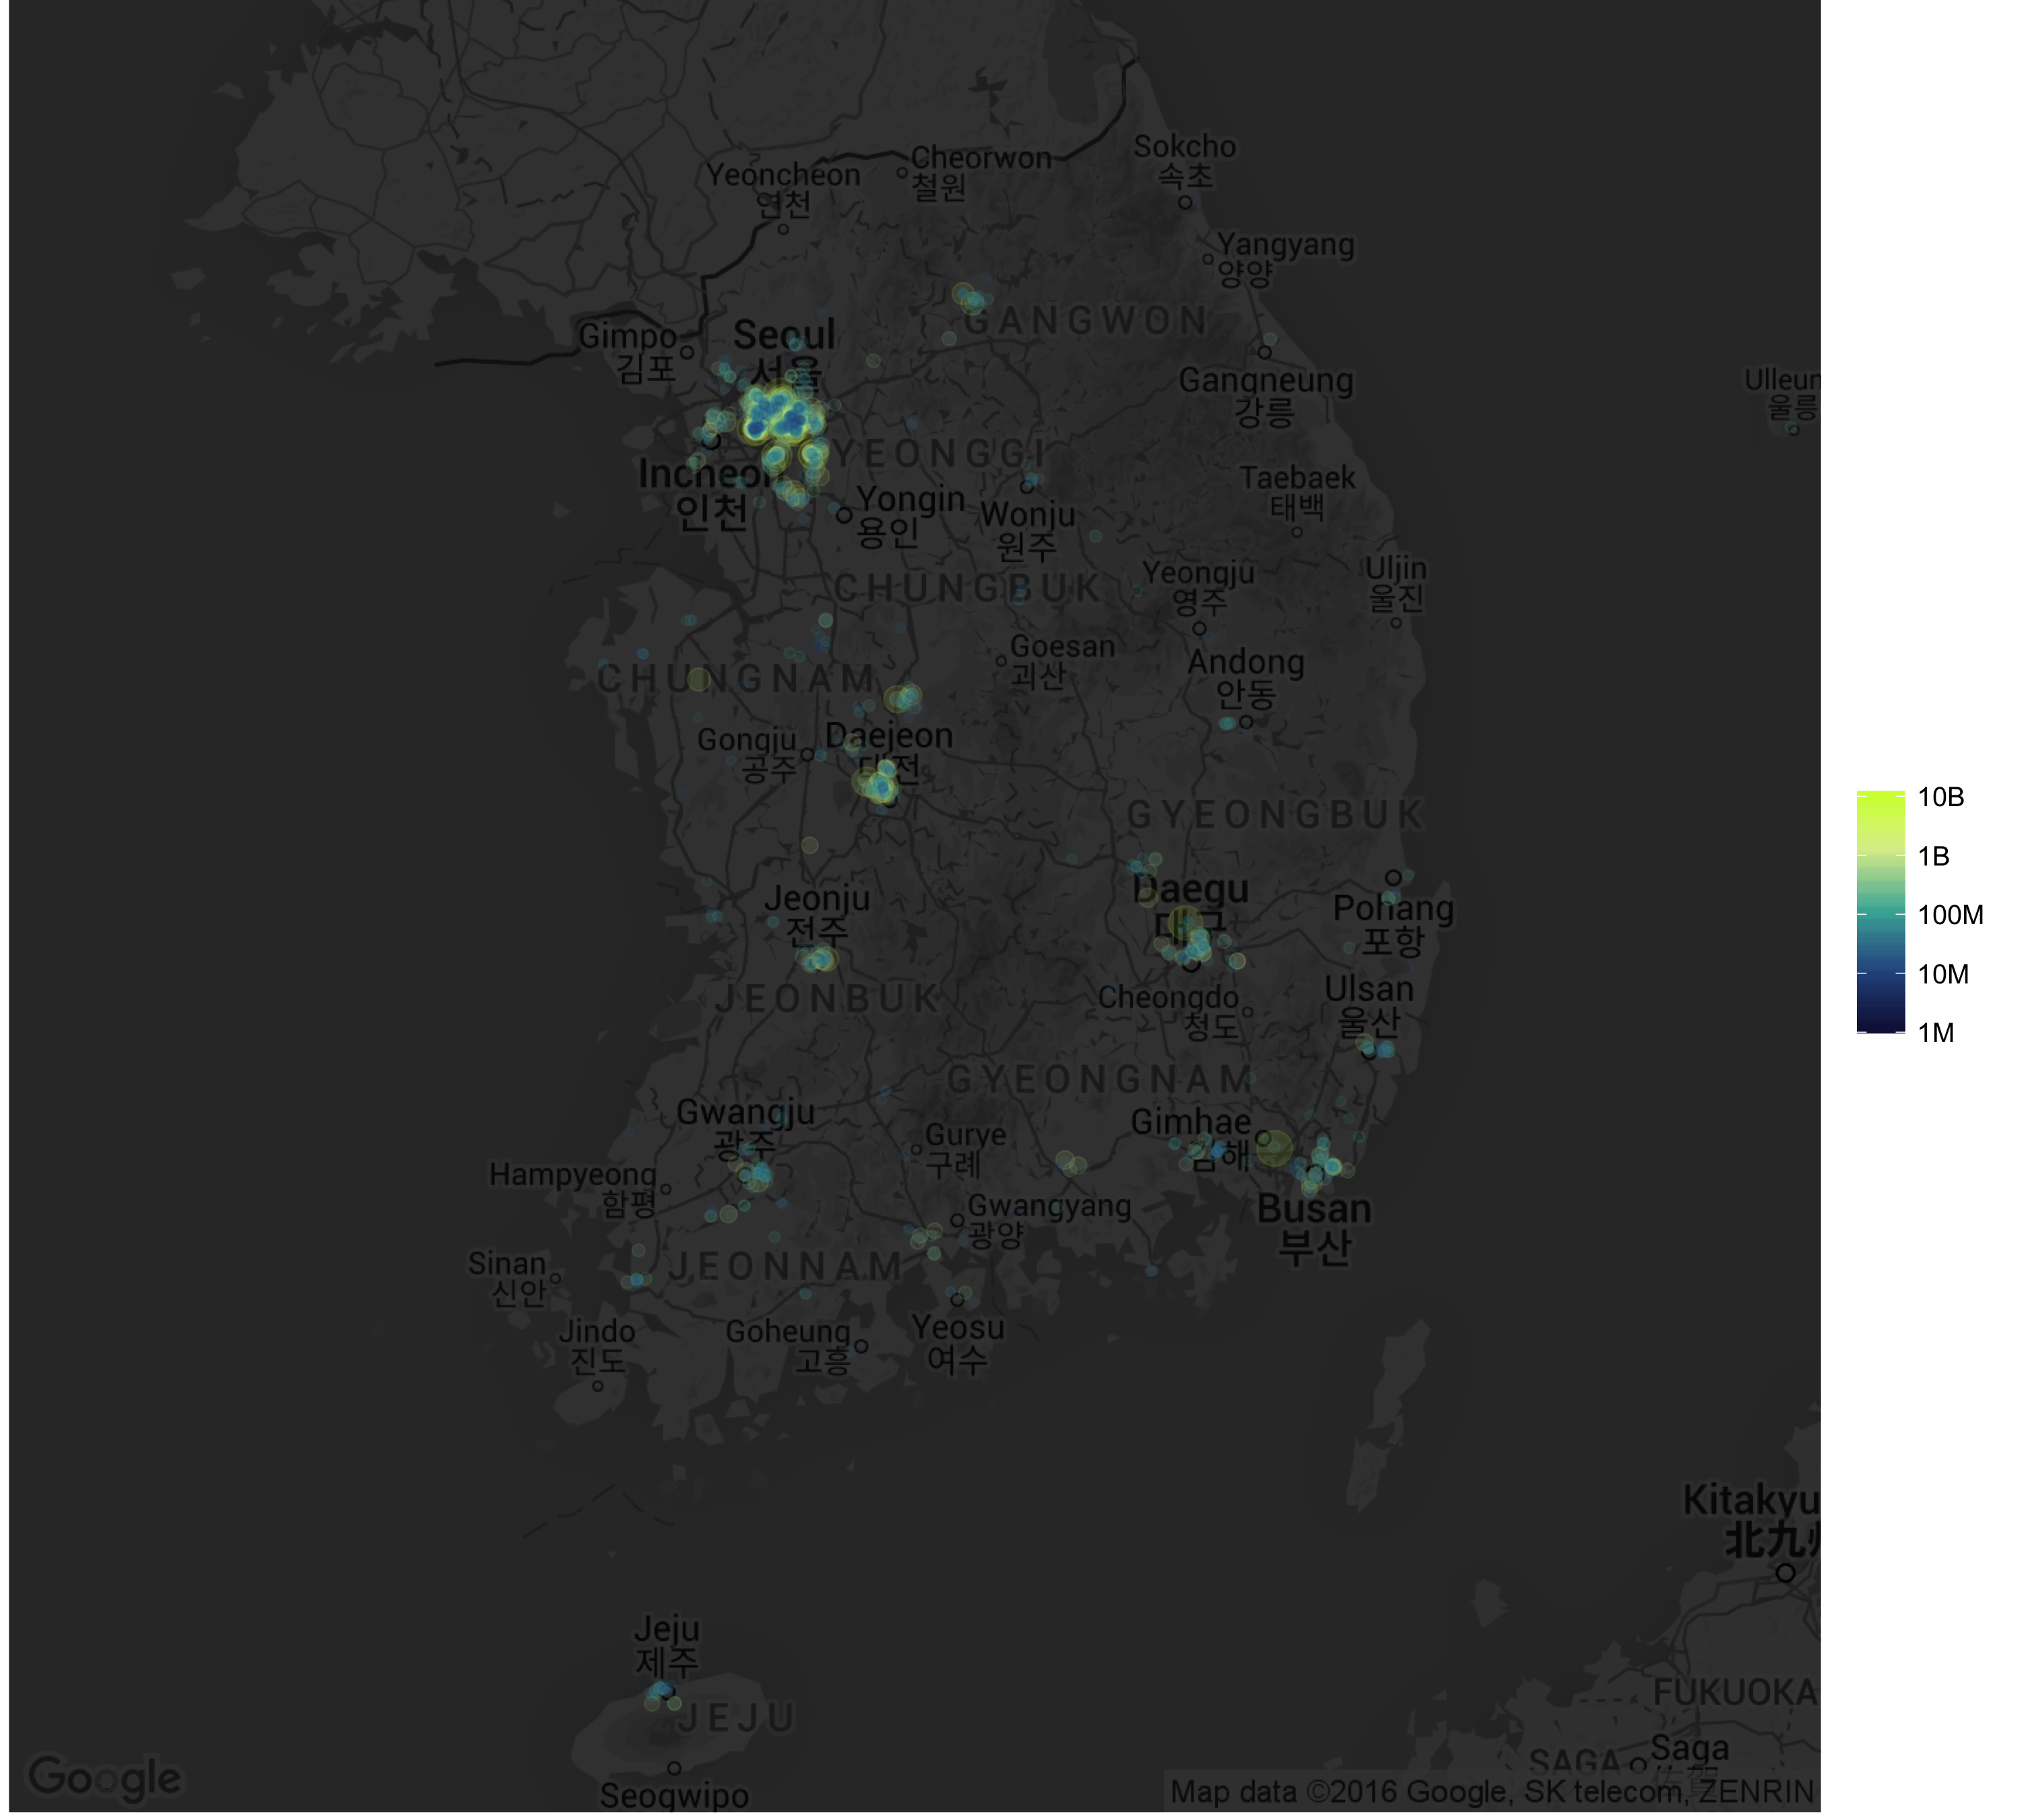
The following map shows each business’ gross win (KRW) by color and size. Higher grossing companies (in green) are concentrated around Seoul, Gyeonggi and Daejeon—where the government complex is located. Other regions have relatively few of them.
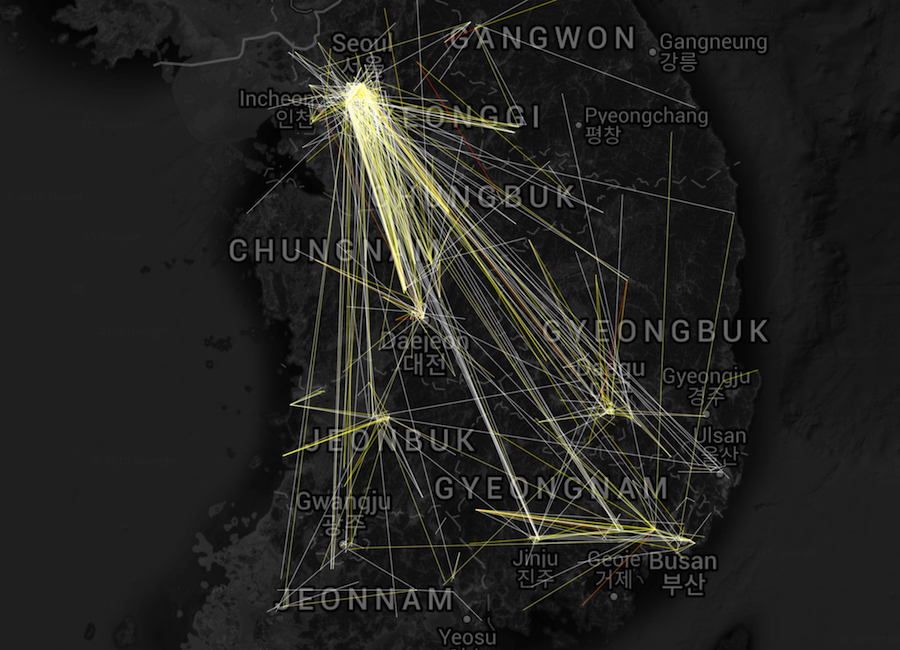
Another way to put the regions in perspective is to connect businesses and the procuring organizations. The following map shows all businesses and government agencies that have had a contract more than once as lines:
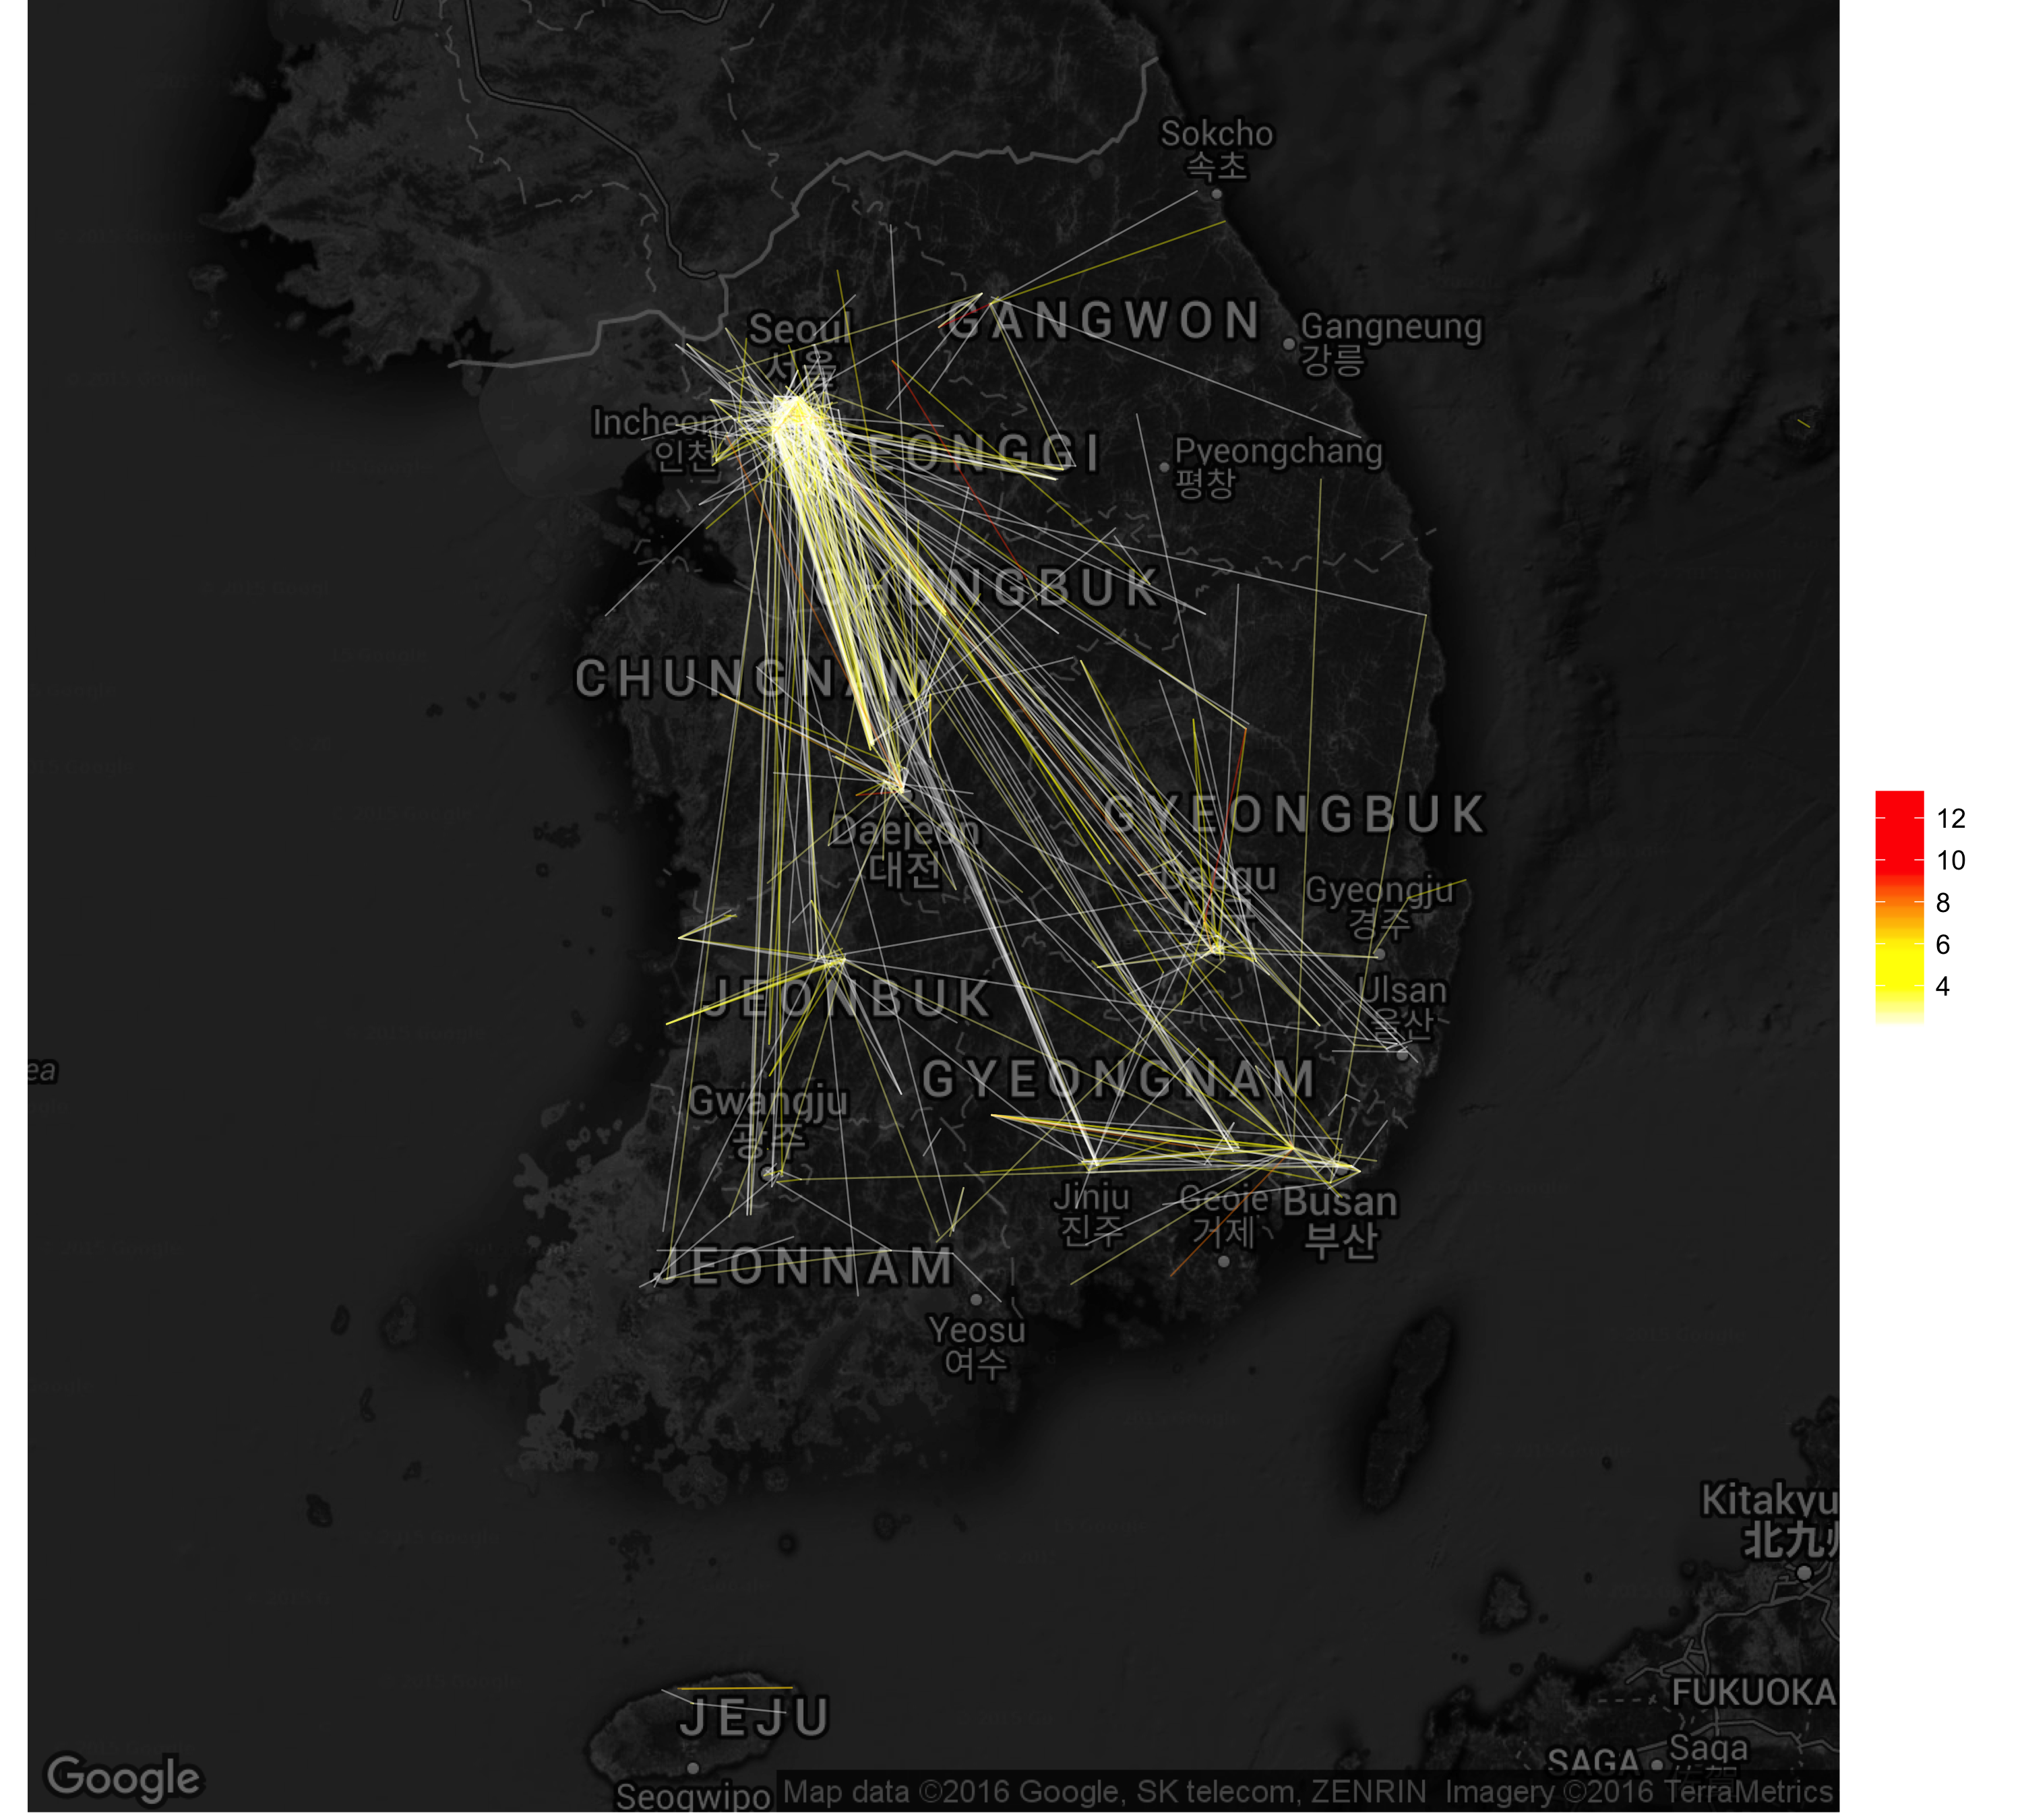
Five contracts or more:
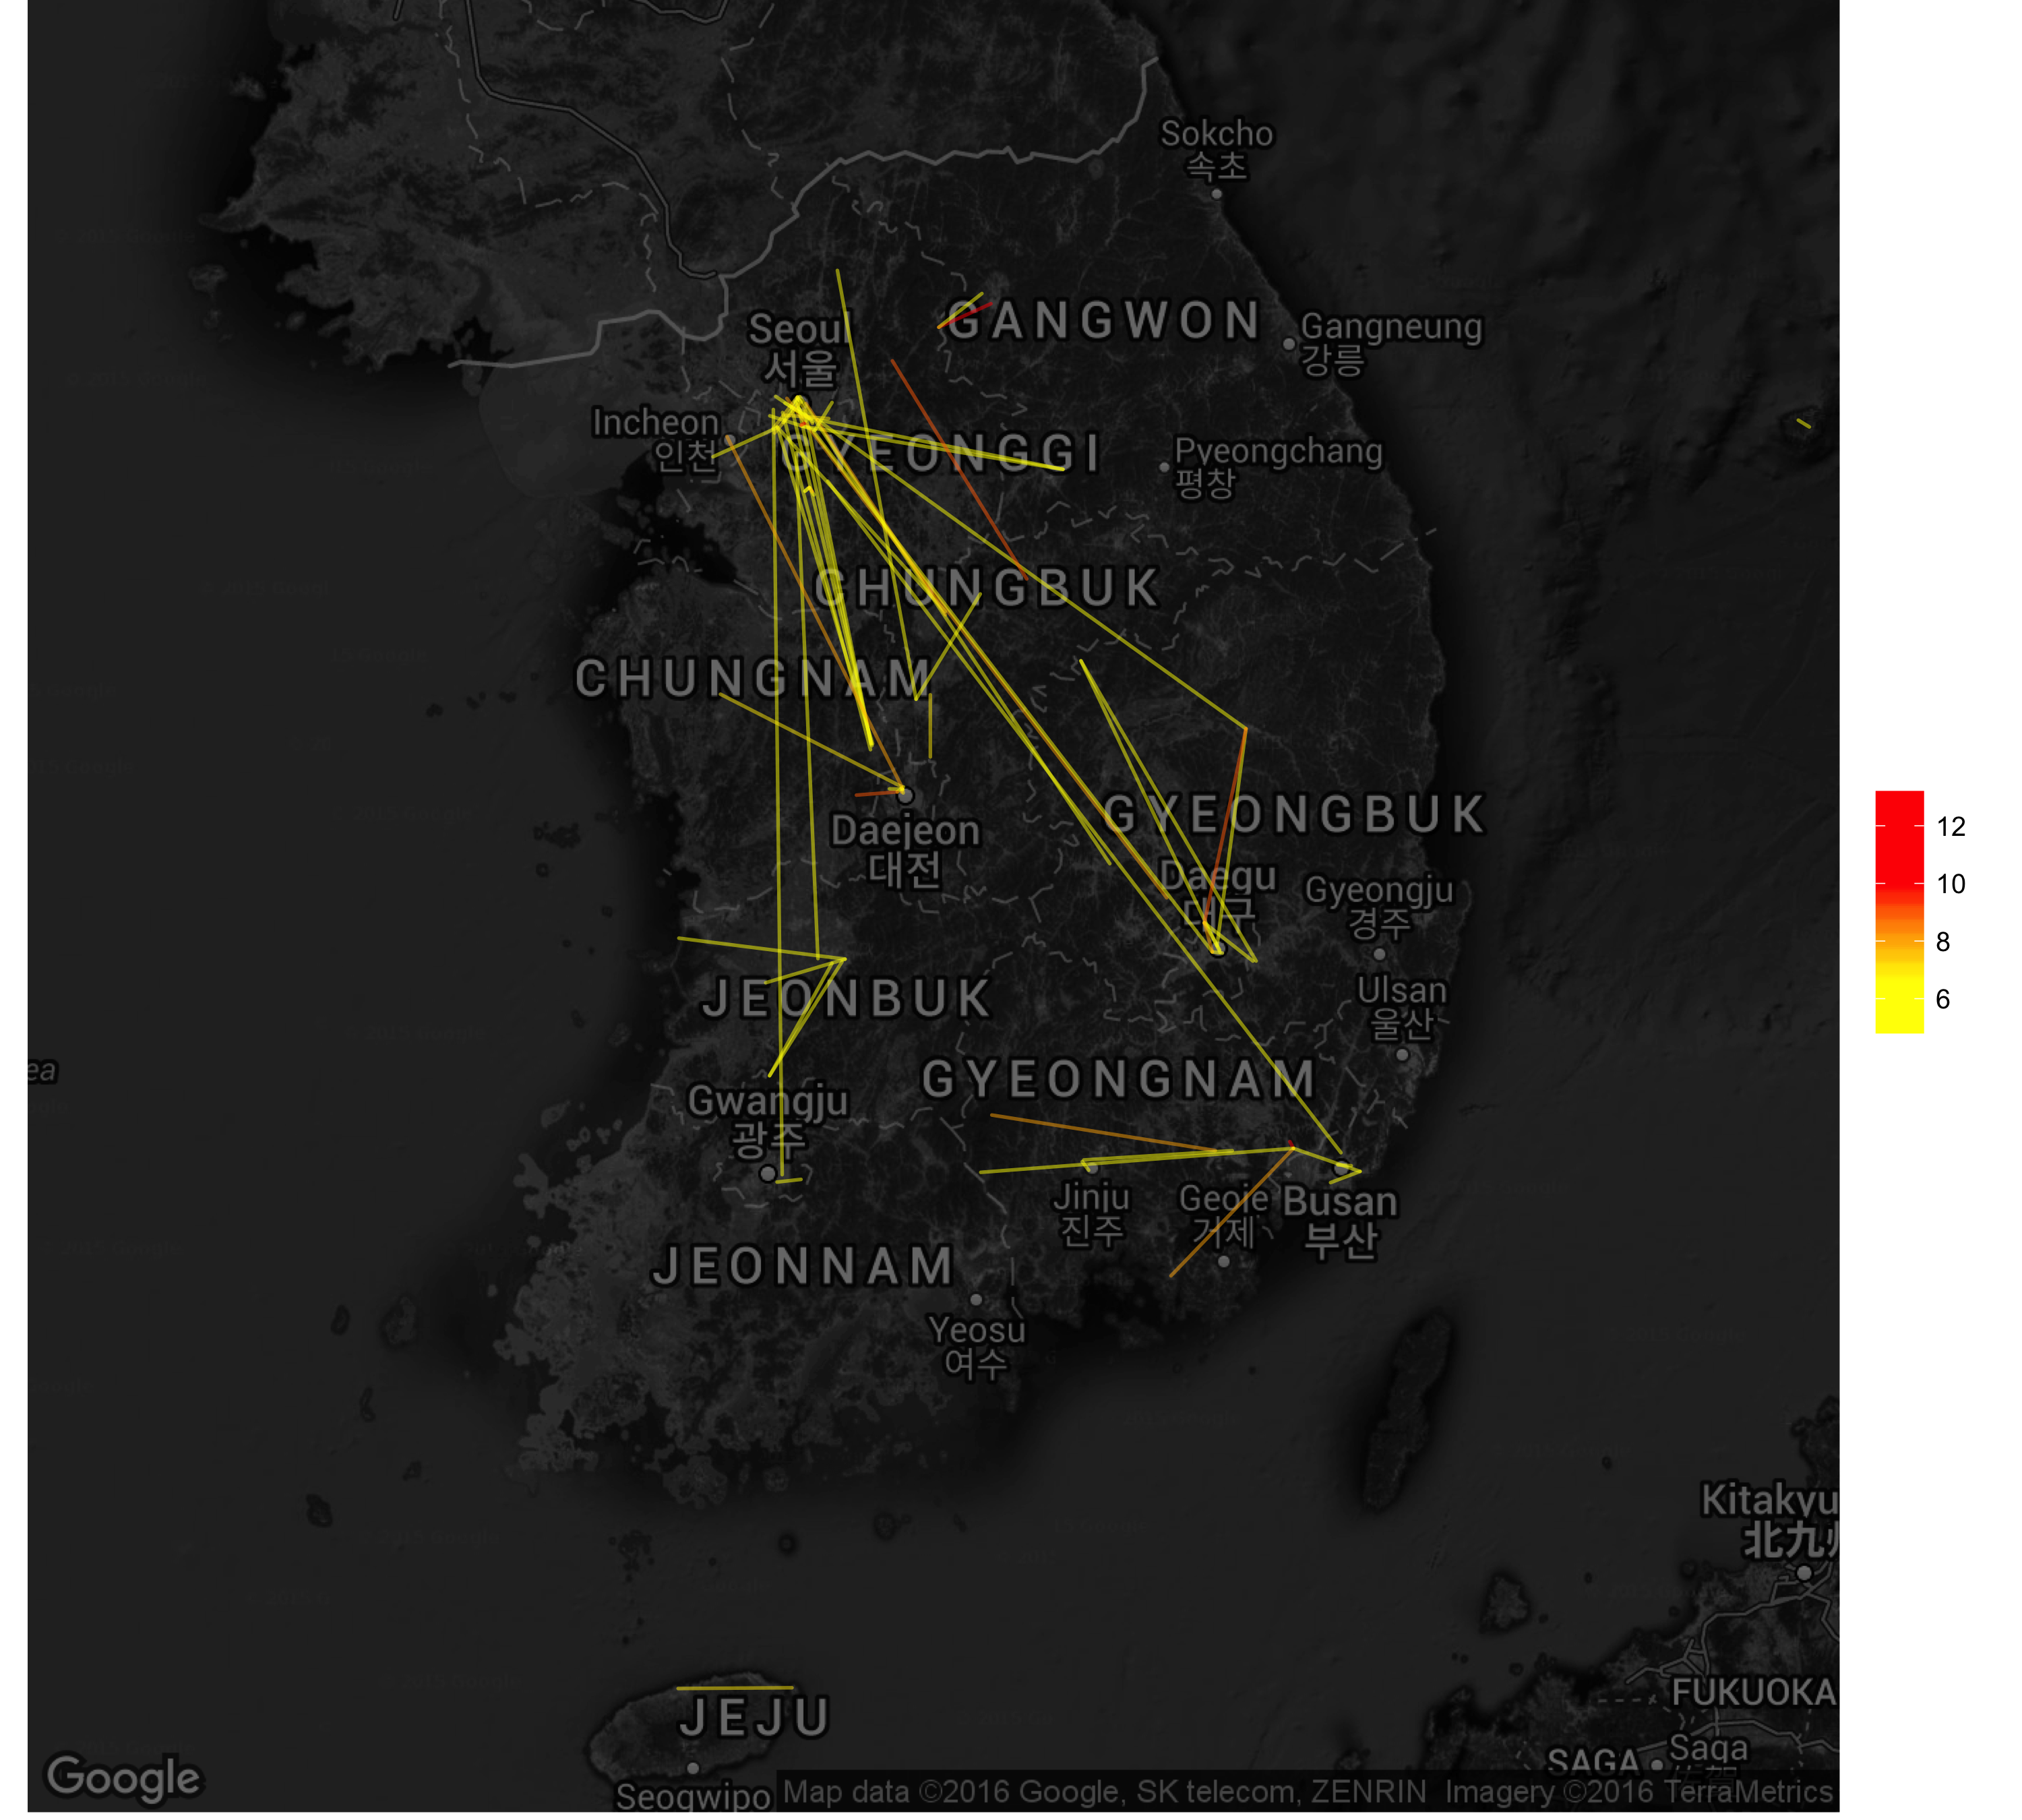
Other than the obvious concentration of transactions within the capital area, one thing to note here is that regions other than the capital area tend to be disconnected with each other. Either the relationship is within the local region, or it is between the region and Seoul. This can be seen as a reflection of the highly centralized society, where Seoul acts as the single hub.
Future research can include a more complete dataset with other auction categories as well. This data visualization project was included in k-www, a collaboration with E Roon Kang and Wonyoung So, which focused on the process and layers (government regulations, IT industry, online communities, etc) that led to the shaping of South Korean internet as it is today.
Tools used: R, plot.ly, DT, ggplot2
data visualization